> ## Documentation Index
> Fetch the complete documentation index at: https://calcs.com/docs/llms.txt
> Use this file to discover all available pages before exploring further.
# How to add a custom cross-section diagram in Calcs Builder
> Step-by-step with a rectangle: width and length inputs, a section-properties remote widget, and a cross-section diagram, plus why both solver and diagram steps are needed.
A common goal in Calcs Builder is to show a simple shape on the sheet, for example a rectangle whose sides come from the user’s width and length (or similar inputs).
To do that, you do not use only a diagram widget. You set up two parts that work like “sketch the shape, then show the picture”:
1. A Remote widget that runs the section properties solver (this turns your rectangle definition into real drawing data).
2. A Diagram widget with a Cross section layer (this draws what the first step returned).
The sections below use a rectangle as the running example, then explain why this two-step pattern exists.
***
## At a glance: who does what?
| Step | What you add | In plain terms |
| ---- | ------------------------------------ | -------------------------------------------------------------------------- |
| 1 | Remote (`solver: sectionProperties`) | “Here is my shape (`sectionsData`), please build the outline I can plot.” |
| 2 | Diagram (type `crossSection`) | “Take the result from step 1 and put it on the page (lines, box, labels).” |
Remote is the step that computes the outline. Diagram is the viewer on the sheet.
If you only put the rectangle definition on the diagram and skip the remote, the cross-section view has nothing to draw (no `lines` yet), so the plot can stay empty.
This is the same idea as many steel/timber modules: the section is solved first; the small preview uses solved geometry, not the raw `sectionsData` by itself.
***
## Example: how to set up a rectangle
Here is a typical setup so the user enters width and length, and the sheet shows a rectangular cross-section plot.
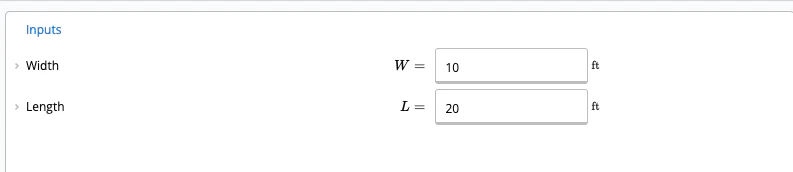
For example, add an input for width and one for length (or whatever you want to label them).
Give each widget a clear reference ID you will use in math, for example `W` and `L`. Those are the names your equations will see (the symbol shown in the UI can still be a longer label if you prefer).
 * Solver: `sectionProperties`
* Reference ID: pick one name and stick to it everywhere below, for example `xsect`
* Solver: `sectionProperties`
* Reference ID: pick one name and stick to it everywhere below, for example `xsect`
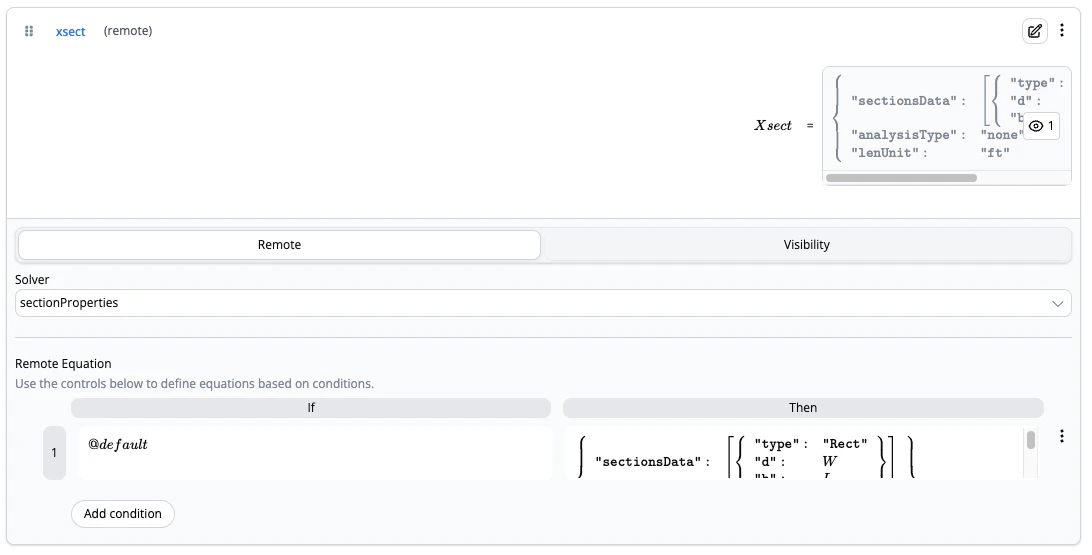 In the equation (usually one row, condition `@default`), set the result to an object that:
* describes the rectangle in `sectionsData`, using your inputs (depth/width for a `Rect` are `d` and `b`, match them to your width/length);
* sets `lenUnit` to match your inputs (for example `"ft"` if the user types feet);
* for outline only, you can set `analysisType` to `none` so the solver just prepares the drawing, not a full property run.
Shape of the `result` (simplified):
```text theme={null}
{
sectionsData: [{ type: "Rect", d: W, b: L }],
analysisType: "none",
lenUnit: "ft"
}
```
Adjust `W` and `L` to match your actual reference IDs and your unit string if different.
* Add a Diagram from the widget palette.
* In the diagram settings, set the type to cross section (one layer).
In the equation (usually one row, condition `@default`), set the result to an object that:
* describes the rectangle in `sectionsData`, using your inputs (depth/width for a `Rect` are `d` and `b`, match them to your width/length);
* sets `lenUnit` to match your inputs (for example `"ft"` if the user types feet);
* for outline only, you can set `analysisType` to `none` so the solver just prepares the drawing, not a full property run.
Shape of the `result` (simplified):
```text theme={null}
{
sectionsData: [{ type: "Rect", d: W, b: L }],
analysisType: "none",
lenUnit: "ft"
}
```
Adjust `W` and `L` to match your actual reference IDs and your unit string if different.
* Add a Diagram from the widget palette.
* In the diagram settings, set the type to cross section (one layer).
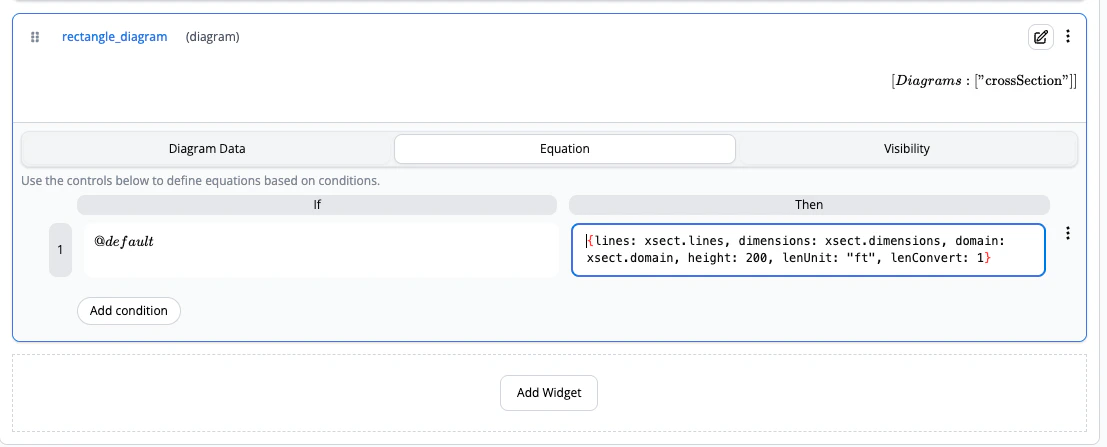
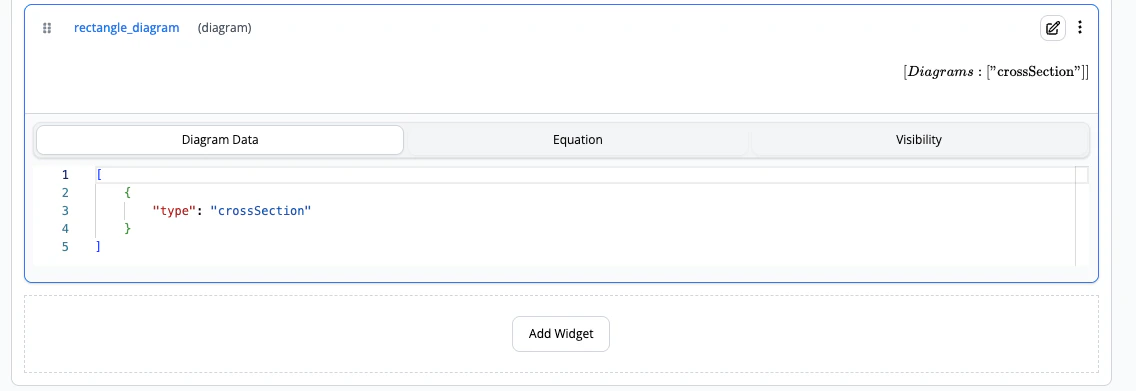 In the equation (again often `@default`), the result should read from the remote you named in step 2, not re-define the rectangle. Point at the solved outline:
```text theme={null}
{
lines: xsect.lines,
dimensions: xsect.dimensions,
domain: xsect.domain,
height: 200,
lenUnit: "ft",
lenConvert: 1
}
```
In the equation (again often `@default`), the result should read from the remote you named in step 2, not re-define the rectangle. Point at the solved outline:
```text theme={null}
{
lines: xsect.lines,
dimensions: xsect.dimensions,
domain: xsect.domain,
height: 200,
lenUnit: "ft",
lenConvert: 1
}
```
 **The name you use in the diagram (for example `xsect` in `xsect.lines`) must be the same reference ID you gave the remote in step 2.** If the remote is `xsect`, use `xsect.lines`, and so on. If you named the remote `myShape`, use `myShape.lines`, and so on.
Change the width and length. The remote re-runs, then the diagram updates. If the plot is blank, double-check the names in step 3 and that the remote’s equation is not empty (see Troubleshooting).
A rectangle in `sectionsData` often uses the `Rect` type with two side lengths, `d` and `b`. You decide which user input maps to which, for example width to `d` and length to `b`, as long as it matches your plan or section convention.
***
## Why you can’t do it in one diagram step
The cross section layer on a diagram is a display. It expects the same data our solvers use for a finished outline: polylines (`lines`), a bounding area (`domain`), and optional dimensions.
That data is produced when the section properties solver ingests your `sectionsData`. The diagram does not re-run that full process inside the widget, so the remote step is required to go from “I want a Rect” to “here are the lines to draw”.
***
## If your section is already solved somewhere else
Some modules already feed a solved section (for example a linked or database member). Then the diagram might only reference an existing object (e.g. `xsect.lines` with `xsect` defined earlier). The rule is unchanged: the diagram always plots solved `lines` and `domain`, not the raw `sectionsData` on its own.
***
## Troubleshooting (builder)
The result on that equation row is actually blank. Fix the row so it has a full result string, or remove unused rows. This is a validation message, not a complaint about the geometry yet.
1. Confirm the Remote is saved with `sectionProperties`, non-empty `result`, and a reference ID.
2. In the Diagram equation, use that exact name: `myRef.lines`, `myRef.dimensions`, `myRef.domain` (e.g. `xsect.lines` if the remote is `xsect`).
3. Check `lenUnit` and `lenConvert` match the units you use in inputs.
Equations use reference IDs (e.g. `W`, `L`, `xsect`), the names you set in the builder, not a fake `@` syntax. Mismatches here fail when the sheet evaluates, not as “empty result.”
***
## See also
Solvers, payloads, and `referenceId`
Legacy diagrams, including cross sections
End users of a published calc usually only see the inputs and the picture. The remote and diagram split is mainly for template authors setting this up in Calcs Builder.
**The name you use in the diagram (for example `xsect` in `xsect.lines`) must be the same reference ID you gave the remote in step 2.** If the remote is `xsect`, use `xsect.lines`, and so on. If you named the remote `myShape`, use `myShape.lines`, and so on.
Change the width and length. The remote re-runs, then the diagram updates. If the plot is blank, double-check the names in step 3 and that the remote’s equation is not empty (see Troubleshooting).
A rectangle in `sectionsData` often uses the `Rect` type with two side lengths, `d` and `b`. You decide which user input maps to which, for example width to `d` and length to `b`, as long as it matches your plan or section convention.
***
## Why you can’t do it in one diagram step
The cross section layer on a diagram is a display. It expects the same data our solvers use for a finished outline: polylines (`lines`), a bounding area (`domain`), and optional dimensions.
That data is produced when the section properties solver ingests your `sectionsData`. The diagram does not re-run that full process inside the widget, so the remote step is required to go from “I want a Rect” to “here are the lines to draw”.
***
## If your section is already solved somewhere else
Some modules already feed a solved section (for example a linked or database member). Then the diagram might only reference an existing object (e.g. `xsect.lines` with `xsect` defined earlier). The rule is unchanged: the diagram always plots solved `lines` and `domain`, not the raw `sectionsData` on its own.
***
## Troubleshooting (builder)
The result on that equation row is actually blank. Fix the row so it has a full result string, or remove unused rows. This is a validation message, not a complaint about the geometry yet.
1. Confirm the Remote is saved with `sectionProperties`, non-empty `result`, and a reference ID.
2. In the Diagram equation, use that exact name: `myRef.lines`, `myRef.dimensions`, `myRef.domain` (e.g. `xsect.lines` if the remote is `xsect`).
3. Check `lenUnit` and `lenConvert` match the units you use in inputs.
Equations use reference IDs (e.g. `W`, `L`, `xsect`), the names you set in the builder, not a fake `@` syntax. Mismatches here fail when the sheet evaluates, not as “empty result.”
***
## See also
Solvers, payloads, and `referenceId`
Legacy diagrams, including cross sections
End users of a published calc usually only see the inputs and the picture. The remote and diagram split is mainly for template authors setting this up in Calcs Builder.