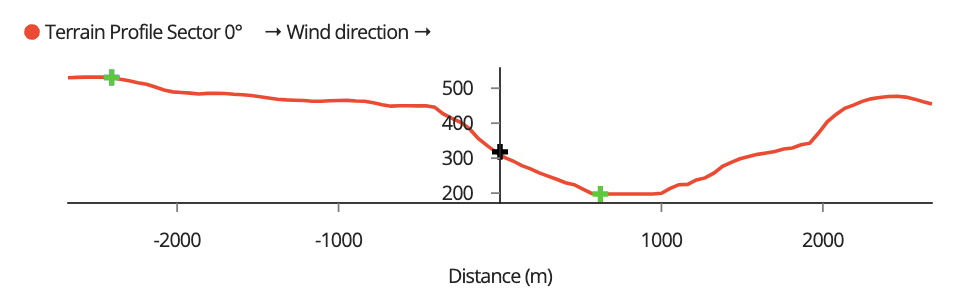
 Figure 12. Example Terrain Profile Graph for 0-Degree Sector
Wind & Terrain
ESICS: Terrain Profile by Sector
ESICS: Terrain Profile by Sector
This section contains the graphical representation of the terrain profile of the project location in all twelve directions. This section can be specifically helpful for validating the orography results from the automatic orography properties in each direction. Figure 12 demonstrates an example terrain profile in the 0-degree sector. Keep in mind that the direction of the wind is stated on the graphs and is left to right.
Figure 12. Example Terrain Profile Graph for 0-Degree Sector
Figure 12. Example Terrain Profile Graph for 0-Degree Sector